


The gap between “I have sensors” and “I have answers” used to be measured in sprints. We closed it in a single afternoon.
IoT projects have a reputation: months of integration work, custom middleware, ongoing maintenance, and a growing pile of dead batteries. But what if the sensors never needed batteries? And what if AI could build and operate the cloud infrastructure for you?
This post walks through how we combined Energous’s wireless-powered e-Compass platform with AWS services — assembled by an AI development environment and queried through natural language — to go from raw sensor data to a live monitoring dashboard in under an hour.
The sensors that never die
At the heart of this solution is Energous’s fully integrated wireless-power IoT stack — the first of its kind to bring transmitters, tags, and cloud together into a single, zero-maintenance platform.
Here’s how it works: a PowerBridge Pro transmitter broadcasts RF energy to nearby e-Sense tags — compact, battery-free, waterproof sensors that harvest that energy over the air to power themselves continuously. Each tag delivers real-time temperature and location data with uninterrupted asset visibility, no batteries to swap, no wiring to run, no maintenance windows to schedule.
Managing it all is e-Compass, Energous’s secure cloud platform. It handles transmitter onboarding, zone configuration, sensor registration, and historical reporting through an intuitive interface — you can deploy a fully functional ecosystem in minutes without deep technical expertise.
But what made e-Compass compelling for this project is that it’s built for integration. With a few clicks, I configured it to stream structured sensor data directly into an Amazon SQS queue in my AWS account. From that moment, the data was mine to build on.
This is where most IoT deployments stall. Hardware companies deliver excellent sensors and connectivity — but the software layer that transforms raw data into operational intelligence typically requires custom development, specialized integrations, or expensive middleware platforms. For organizations without in-house development teams, this gap between “data streaming” and “data actionable” can delay time-to-value by months — or kill the project entirely.
AI development tools are changing that equation.
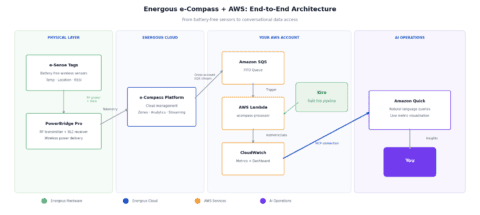
End-to-end architecture: from battery-free sensors to conversational data access
From intent to infrastructure in one conversation
With sensor data streaming into an SQS queue, I needed a processing pipeline — something to receive those messages, extract the sensor readings, and publish them as metrics I could visualize. Traditionally, this means writing a Lambda function, configuring IAM permissions, setting up triggers, defining a CloudWatch namespace, and testing the whole chain. A few days of work for someone comfortable with AWS, longer if you’re not.
I opened Kiro, an AI-powered development environment, and described what I needed: a Lambda function that processes e-Compass messages from an SQS FIFO queue and publishes temperature, location, signal strength, and latency as CloudWatch custom metrics.
Kiro generated the complete solution — the Lambda handler code, the IAM role with scoped permissions for SQS and CloudWatch, the event source mapping to wire the queue to the function, and the CloudWatch metric structure with proper dimensions for filtering by tag. It even handled the cross-account trust policy that allows Energous’s platform to send messages into my queue.
I reviewed the output, deployed it, and within minutes had live metrics flowing into CloudWatch. No boilerplate. No multi-day iteration cycle. The architecture is standard AWS — SQS, Lambda, CloudWatch — but the assembly was anything but.
| What Kiro Built:
• SQS FIFO queue with cross-account access policy • Lambda function (Python 3.12) — parses sensor payloads, publishes 5 metrics per tag • IAM role scoped to SQS receive/delete + CloudWatch PutMetricData • Event source mapping with batch size 10 • CloudWatch namespace: Energous/eCompass |
Talking to your data
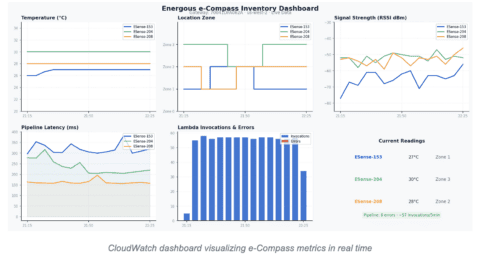
With the pipeline running, I had a CloudWatch dashboard full of live metrics — temperature trends, signal strength, tag health, processing latency. But here’s the thing about dashboards: they answer the questions you thought to ask when you built them. What about everything else?
This is where Amazon Quick changed the workflow. Amazon Quick is an AI-powered desktop companion that connects directly to your AWS account. I configured the connection in about thirty seconds — pointed it at my account via a local MCP server — and suddenly I could interact with my infrastructure through conversation.
“Show me my SQS queues.” Done. “Pull up the Energous e-Compass dashboard and render it visually.” A full interactive visualization appeared — temperature trends, signal strength, location zones, packet counts, latency — all charted and annotated without opening the AWS Console.
“What’s the current temperature on ESense-153?” Twenty-seven degrees Celsius.
This isn’t a gimmick. For someone managing a sensor deployment, the ability to check on assets through natural language — without logging into a console, without remembering which dashboard to open, without navigating metric namespaces — removes real friction from daily operations. And for stakeholders who’d never open the AWS Console in the first place, it makes the data accessible for the first time.
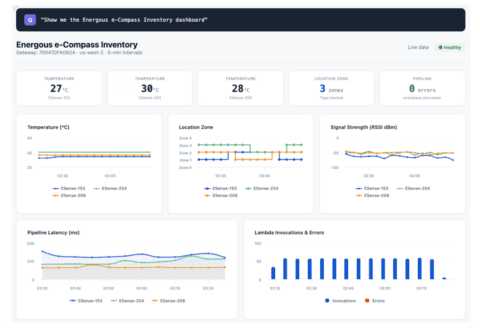
Live dashboard rendered by Amazon Quick from CloudWatch metrics
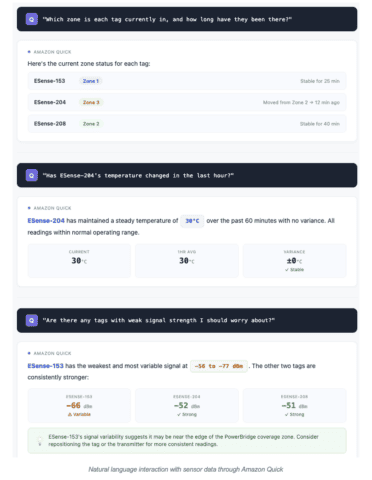
| What Amazon Quick Can Do Here:
• Query any CloudWatch metric by name: temperature, signal strength, location zone, packet count, latency • Render live dashboard visualizations on demand • Inspect pipeline health (Lambda invocations, error rates) • Explore AWS resources without console access • All powered by a local MCP connection to your account |
Where this goes from here
What we built is a starting point — a real-time monitoring layer assembled in an afternoon. But the foundation supports much more.
Richer visualization. The same metrics feeding CloudWatch can flow into Amazon QuickSight or Grafana for historical trend analysis, anomaly detection, and executive reporting across weeks or months of sensor data.
Automated response. CloudWatch Alarms can trigger notifications when conditions change — a temperature threshold breach, a tag going silent, latency spiking beyond acceptable limits. The system doesn’t just observe; it can act.
Custom applications. For organizations that need a tailored experience, the pipeline data is available for custom dashboards, mobile apps, or integration into existing operational tools — all built on the same serverless backbone.
Connected intelligence. Amazon Quick connects to your AWS account through MCP — an extensible protocol that works with any data source you can wrap in an API. Imagine combining real-time inventory visibility from e-Compass with demand signals from your ERP or forecasting system, all queryable through a single conversational interface. The sensor data becomes one input into a broader operational picture.
The gap between “I have sensors” and “I have answers” is closed. The next question is: what decisions will those answers drive?